Bespoke Data Visualization Software
What is Data Visualisation Software?
Data visualization software refers to a specialized type of software that enables businesses and organizations to transform complex data sets into interactive visuals and graphics that are easier to comprehend and analyze. This type of software is designed to help businesses derive meaningful insights from raw data, allowing them to make informed decisions based on accurate information.Contact us if you are wanting to have a bespoke Data Visualization application developed?
The uses of data visualization software are various and wide-ranging. It can be used to develop custom dashboards for tracking key performance indicators (KPIs) across an organization, generate analytical reports for stakeholders, or create more sophisticated tools for predictive modeling and machine learning. More specifically, data visualization software can help businesses identify trends and patterns, understand customer behavior, measure campaign success, identify opportunities for growth, and assess risk.
One of the key benefits of data visualization software is that it can help business owners and decision-makers more easily understand and interpret complex data sets. Rather than relying on static spreadsheets or text-based reports, visualizations allow data to be represented in a more intuitive and engaging format, allowing for easier analyses and more impactful presentations. Overall, data visualization software is a critical tool for modern business intelligence, providing a means for organizations to derive actionable insights and drive success.

What are the main functions of Data Visualisation Software?
Data visualisation software typically comprises of various modules that enable effective presentation of data in a way that allows businesses to make informed decisions. These modules include:1. Data aggregation: This module involves aggregating large volumes of data from various sources, categorizing and structuring it in a way that makes it easy to understand and manipulate.
2. Data analysis: This module provides tools for analyzing data and identifying trends and patterns that can aid business decision-making. It could include tools for correlations, regression analyses, and data modeling.
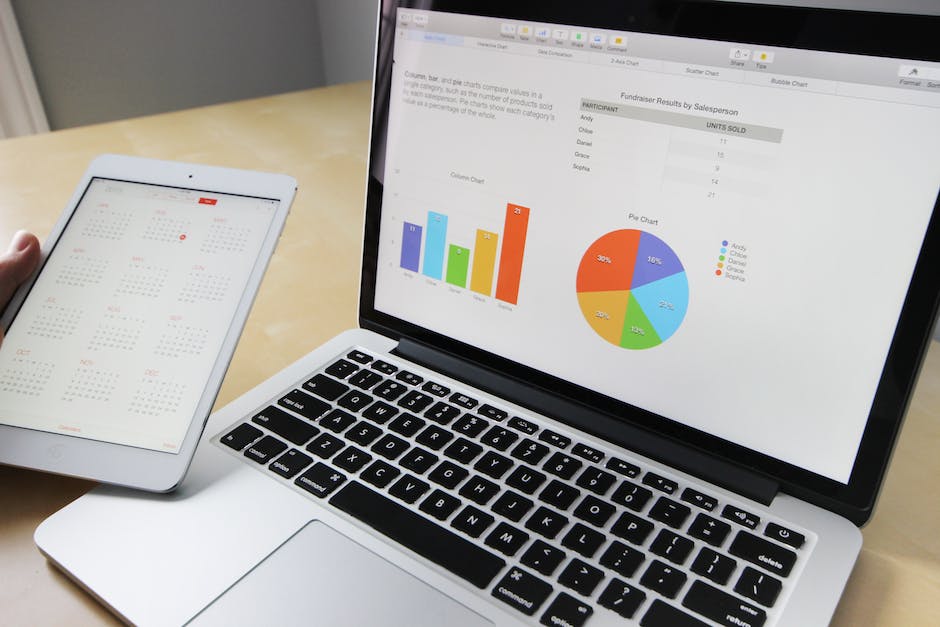
3. Data visualization: This module enables businesses to present data in visually compelling formats such as charts, graphs, dashboards, infographics, and heat maps, among others. The aim is to present the data in an intuitive and easy-to-understand manner, thereby enabling businesses to quickly make sense of it.
4. Data sharing and collaboration: This module allows businesses to share data and collaborate with stakeholders across different functions and geographies. It could include features such as shared dashboards, real-time updates, and collaborative workflow tools.
5. Data security and privacy: This module ensures that data is adequately secured and kept private from unauthorized users. The focus is on ensuring that data remains secure and private throughout the data lifecycle, from acquisition to disposal.
In summary, data visualisation software provides businesses with the tools to effectively manage, analyze, and present data in a way that enables them to make informed decisions.
Data / systems integration
Data visualisation software is often integrated with other systems that collect, store or manipulate data. Some common examples include customer relationship management (CRM) systems, enterprise resource planning (ERP) software, business intelligence (BI) tools and data warehouses.APIs or other tools are typically used to facilitate this integration, and there are several considerations that need to be taken into account when implementing such solutions. For example, it is important to ensure that the data being integrated is accurate, up-to-date and consistent across all systems, as inconsistencies can lead to errors and make it difficult to draw accurate conclusions from the visualisations.
Other considerations include security, scalability, and performance. Depending on the requirements of the project, it may be necessary to implement additional measures to ensure that data is protected from unauthorized access, that the system can handle large volumes of data or user traffic, and that the visualisations are rendered quickly and efficiently.
Overall, the integration of data visualisation software with other systems is a complex process that requires a deep understanding of the underlying technologies and business requirements. As such, it is important to work with experienced developers who can provide the necessary expertise and guidance throughout the project.
Who uses Data Visualisation Software?
Data visualisation software is used by a wide range of organisations across different markets and verticals. Any business that collects and analyses large amounts of data stands to benefit from using data visualisation software. This includes industries such as finance, healthcare, retail, marketing, and many others.Organisation size can also vary, as data visualisation software can be used by small businesses as well as large enterprises. Startups, in particular, may find data visualisation software useful in understanding their market and customer behaviour. Meanwhile, larger organisations can utilise data visualisation software to monitor performance and make data-driven decisions on a strategic level.
Overall, any organisation that wants to gain insights into their data and make informed decisions can benefit from using data visualisation software. By making complex data easier to understand and interpret, this software can help businesses see patterns and trends that might otherwise be missed, leading to more effective decision-making and better outcomes.
Benefits of Data Visualisation Software
Organisations use data visualisation software to gain insights into their data, simplify complex information and provide a more engaging way for decision-makers to analyse and interpret their data. The key benefits of data visualisation software include faster and more accurate decision-making, improved collaboration, increased data transparency, and enhanced communication within the organisation. Data visualisation software provides a more intuitive way to analyse data, enabling users to identify and understand trends, patterns and anomalies in data quickly. It also allows for better data-driven decision-making across the organisation by aggregating and visualising data from multiple sources. Additionally, data visualisation software can improve collaboration by allowing team members to share and collaborate on data visualisations easily. This enables users to work together to derive insights and make informed decisions. Finally, data visualisation software can promote better communication between teams, departments and stakeholders, by providing a visual representation of complex data that is easier to understand and interpret. Overall, data visualisation software is a valuable tool for organisations looking to gain insights, streamline workflows and make data-driven decisions.Some of the players in the Data Visualisation Software market
Tableau: This brand is widely recognized as one of the most popular data visualization tools on the market. It's user-friendly guide interface and wide variety of customization options make it a preferred option for a lot of businesses. However, customers tend to find that it can be sluggish when working with large datasets.QlikView: Known for its easy-to-use dashboard and analysis software, QlikView provides great insight into a range of business operations. However, it has some limitations when it comes to data governance, which may make it less attractive to larger enterprises.
Microsoft Power BI: A widely adopted software suite that offers a range of data visualization and analysis tools. One notable downside is that its data preparation features do not stack up to some of its competitors.
Domo: This platform provides businesses with a wide range of data visualization and analysis tools, as well as strong security features. However, some users report that the interface can be somewhat overwhelming, leading to a steep learning curve.
Oracle Business Intelligence: A powerful, comprehensive business intelligence suite used by many large enterprises. However, the steep licensing fees associated with Oracle Business Intelligence can be an issue for smaller businesses. Some customers have also reported that the interface is not as user-friendly as other options.
Overall, businesses will need to carefully consider their needs and priorities before selecting a data visualization software that best suits their needs. It's important to balance the benefits and limitations of each option against what you need to achieve as a business.
Benefits of off-the-shelf Data Visualisation Software
Off-the-shelf data visualisation software offers a number of key benefits for businesses. Firstly, it is typically less expensive than custom software, as it is designed to meet the needs of a broad market rather than the specific requirements of one company. This means that it can be an affordable way for businesses to start harnessing the power of data visualisation.Secondly, off-the-shelf software is often more user-friendly than custom-built solutions. It is designed to be intuitive and easy to use, with pre-configured settings that can be adjusted to match a company's specific needs. This means that businesses can get up and running quickly, without having to invest in extensive training or support.
Another advantage of off-the-shelf data visualisation software is that it is often more widely supported than custom software. This means that businesses can benefit from the knowledge and expertise of a large community of users and developers, and can access a wealth of resources and support.
Finally, off-the-shelf software is typically more scalable than custom-built solutions. As a business grows and its data requirements change, it can simply add more licenses or upgrade to a more comprehensive version of the software. This allows businesses to adapt to changing needs without having to invest in a whole new software solution.
Limitations of off-the-shelf Data Visualisation Software
Off-the-shelf data visualisation software can be a great solution for businesses that need to quickly and easily create basic visuals. However, these types of software have significant limitations when it comes to creating customised data visualisations that meet the unique needs of a specific business.One limitation is that off-the-shelf software often has a limited range of chart types and data visualization options. While there may be a handful of basic chart types available, these types may not be sufficient for complex data sets that require unique visualisations.
Another limitation is the lack of flexibility in terms of data formatting and data sources. Most off-the-shelf data visualisation software have preset formatting and data source requirements. This means businesses may be limited in the data they can input, and how they can present that data to their audience.
Difficulty in integrating with other software is also a significant limitation. Often, businesses have multiple software tools in their technology stack, and it can be challenging to integrate off-the-shelf data visualisation software with other tools.
Lastly, security is a crucial concern when selecting any software tool. With off-the-shelf data visualisation software, there may be concerns about data privacy and security since many businesses may not know how their data is being handled, stored, and used.
Overall, while off-the-shelf data visualisation software can be a quick and easy solution for some businesses, it has limitations that may make it inappropriate for others. Custom-developed data visualisation software tailored to meet specific business needs can mitigate these limitations and create a more sophisticated and effective visualisation solution.
Is bespoke Data Visualisation Software a viable option?
Bespoke or partially bespoke data visualisation software provides businesses with an incredible opportunity to gain unique insights into their data that would otherwise not be possible. This kind of software allows them to customise the visualisation elements and insights specific to their industry, business model and data sources, making it much more efficient and effective than off-the-shelf solutions.One great example of this is the use of bespoke data visualization software in the financial industry. Financial businesses can use this software to monitor key metrics such as share prices, stock market predictions, and even cryptocurrency trends to identify opportunities for investment. Thanks to the customisation of the software, businesses can view data in real-time and identify trends and patterns quickly, allowing them to make informed decisions and stay ahead of the competition.
Another great use case is in the healthcare industry, where bespoke data visualisation software can help identify medical trends and patterns in patient data, which can have huge implications for medical research and drug development. The software can also help track the spread of infectious diseases and enable real-time response to outbreaks.
Overall, the benefits of bespoke data visualisation software are clear. It offers far greater flexibility, can reduce the time and effort needed to interpret data, and can help businesses make better-informed decisions. It's no surprise that many businesses are opting for bespoke solutions to gain an edge in their industries.
Fun facts about Data Visualisation Software
Data visualization is a rapidly growing industry with a projected compound annual growth rate of 9.2% from 2021-2026.According to the World Economic Forum, businesses that incorporate data visualization into their decision-making process are 28% more likely to outperform their peers.
Research has shown that 90% of information transmitted to the brain is visual, making data visualization a powerful tool for communicating complex data.
Interactive data visualization tools, which allow users to manipulate and explore data on their own, are becoming increasingly popular. In fact, nearly 75% of Fortune 500 companies use this type of software.
Modern data visualization software often employs artificial intelligence and machine learning algorithms to automatically suggest visualizations based on the data being analyzed.
One of the biggest challenges facing businesses today is data overload, and data visualization software can help by transforming large, complex datasets into easily understandable and actionable insights.
A recent study found that businesses that use data visualization report higher employee engagement, more informed decision-making, and better business performance.
Overall, the trend towards data-driven decision making and the proliferation of data sources means that data visualization software will continue to play a crucial role in business operations for years to come.
Data Visualisation Software FAQ
1. What is data visualisation software and what are its benefits?Data visualisation software is a tool that helps businesses to present and visualise their data in a more meaningful and understandable way. It allows businesses to gain insights into their data and identify trends or patterns that may go unnoticed through traditional data analysis methods. The benefits of data visualisation software include improved decision-making, increased efficiency, better communication, and the ability to identify areas for improvement.
2. Is custom data visualisation software necessary for my business?
Custom data visualisation software is not necessary for every business, but it can provide significant benefits for those who handle large amounts of data or complex data sets. If you find that your current data management tools are not meeting your needs or that you are struggling to make sense of your data, then custom data visualisation software may be the solution you need.
3. What features should I look for in data visualisation software?
The features needed in data visualisation software will depend on the specific needs of your business. However, some key features to look for include the ability to create custom visualisations, interactive dashboards, real-time data updates, and the ability to drill down into data for deeper insights.
4. How long does it take to develop custom data visualisation software?
The development timeline for custom data visualisation software will depend on the complexity of the project and the specific requirements of your business. Generally, the development process can take several months to a year or more, with factors such as the number of features needed, the size of the development team, and the testing and debugging process all impacting the timeline.
5. What are the costs involved in developing custom data visualisation software?
The costs involved in developing custom data visualisation software will vary depending on factors such as the complexity of the project, the number of features needed, the size of the development team, and the amount of testing and debugging required. It is important to work with a reputable software development company that can provide a clear and transparent pricing model and ensure that you are aware of all costs involved in the development process.
6. How can I ensure that my data is secure when using data visualisation software?
Data security is a top concern for businesses when it comes to using data visualisation software. To ensure that your data is secure, it is important to work with a software development company that has a strong track record in data security and can provide secure hosting options for your data. It is also important to implement proper data access controls and encryption methods to further protect your sensitive information.
7. How can I ensure that my custom data visualisation software is user-friendly and easy to use?
User-friendliness is an important factor to consider when developing custom data visualisation software. To ensure that your software is user-friendly, it is important to involve end-users in the development process and get their feedback on features and functionality. Additionally, it is important to work with a software development company that has experience in creating user-friendly interfaces and can provide extensive testing and user training to ensure that your software is easy to use and meets the needs of your business.
Next Steps?
Are you tired of struggling to make sense of your company's data? Are you looking for a more efficient and effective way to analyse and interpret information? Look no further than custom data visualisation software.At our bespoke software development company, we understand the importance of clear and concise data representation. That's why we specialize in creating custom solutions tailored to meet the unique needs of each individual business. Our data visualisation software is designed to make data analysis and interpretation a breeze, no matter the scope or complexity of your data.
But we don't just stop at data visualisation. We also offer comprehensive systems integration and data migration services to ensure a smooth transition to your new software. Our team of experts is dedicated to providing exceptional service and support every step of the way.
So don't let your data hold you back! Contact us today and let us help you take control of your data with our custom data visualisation software and expert services.
Read more about the main software category Collaboration Applications.
Other services in Collaboration Applications category:
Want a quick quote for the development of custom Data Visualization Application?
Contact us to discuss your questions about bespoke Data Visualization Applications.